

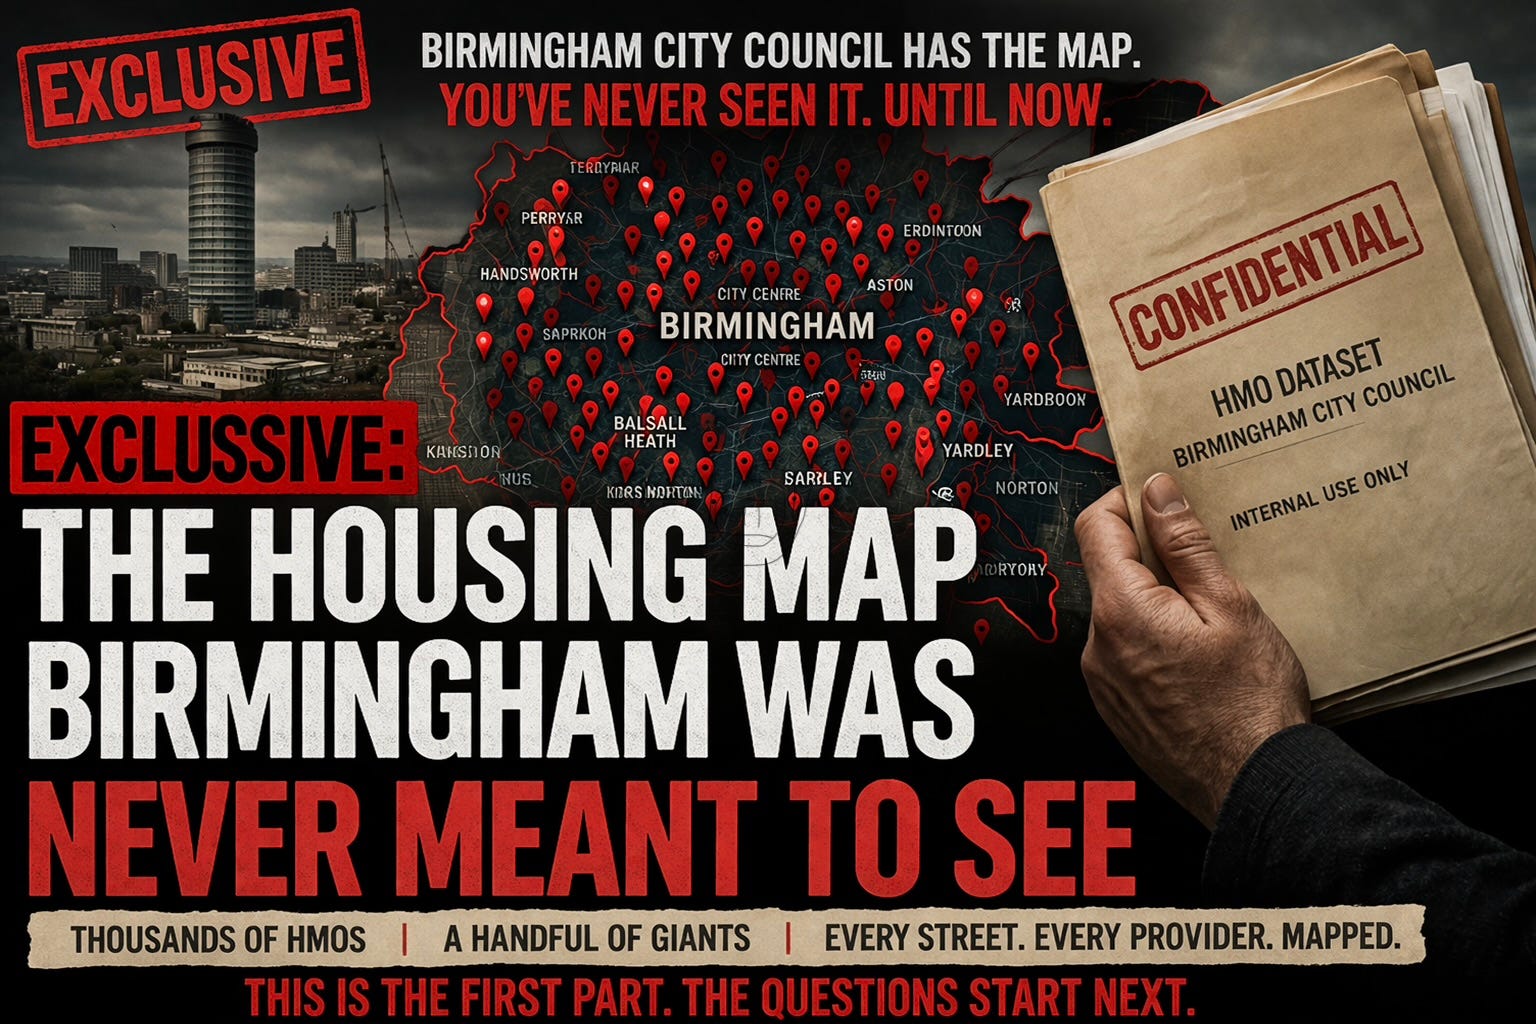
EXCLUSIVE: The housing map Birmingham was never meant to see
A council dataset reveals thousands of HMOs, concentrated under a handful of providers. This is the first part of what it shows.

EXCLUSIVE: I have in front of me a document that Birmingham City Council already holds, but one that the public rarely, if ever, sees presented like this. It is not a press release, not a summary, and not something prepared for public consumption. It is working information, detailed, structured, and comprehensive.
Over the coming days, we will be publishing what it shows. This is the first part of that work.
The document lists properties across Birmingham with addresses, postcodes, areas and, crucially, the organisations responsible for operating them. Property by property, street by street, it sets out how this part of the housing system actually functions. It is, in effect, a map of the system as it really exists.
That matters, because most people have never seen it like this before. They may know there are HMOs in their area. They may have noticed changes in their street, a different feel, a different turnover of residents, a shift that is hard to put your finger on but is there all the same. What they have not been shown is the full picture.
And when you see the full picture, it changes things.
The first thing that stands out is not just the number of properties, although that is significant in itself. It is who is running them. The same names appear again and again. Different streets, different neighbourhoods, but the same organisations turning up repeatedly. What most people assume is a loose collection of landlords turns out to be something far more concentrated.
The numbers make that clear. This is not a handful of properties here and there. The dataset runs into many thousands of addresses across Birmingham. One provider alone is linked to well over two thousand properties. Another runs into the thousands. Several more control hundreds each. This is not a long tail of small operators. It is a relatively small number of organisations working at serious scale.
That changes how you understand the system. It is no longer about isolated cases or one-off problems. It is about a structure that has developed across the city, quietly but steadily, over time.
When those properties are looked at together, rather than one at a time, another point becomes obvious. They are not spread evenly. They cluster. Streets begin to show the same provider names more than once. Neighbourhoods begin to lean in a particular direction. What looks balanced when you pass through it starts to look very different when you step back and take it in as a whole.
That is the moment the map shifts from being a list of addresses to something else entirely.
Because this is not just about where properties are. It is about how areas are changing.
There may be explanations for how this has come about. Housing demand is high and supply is under constant pressure. Organisations expand where they are able. One property leads to another, and over time portfolios grow. That is how markets often behave, particularly when there is sustained demand and limited alternatives.
But when the same providers appear over and over again, and when those operations reach into the thousands of properties, it is only reasonable to ask whether this is simply organic growth or something more structured than that.
No accusation is needed to raise that question. The pattern is visible in the data. In any sector, when activity concentrates in relatively few hands, it tells you something. It tells you who has scale, who has reach, and who is shaping how that sector develops.
What matters just as much is that none of this sits outside the view of those responsible for overseeing housing in the city. The properties are known. The providers are known. The scale is known. This is not new information that has suddenly come to light. It already exists within the system.
Which brings the issue into much sharper focus.
If the structure is visible, then the question is no longer what is happening. The question is what has been done in response to it, and whether that response matches the scale of what is now clearly in front of us.
It is important to be fair at this point. Not every HMO is poor. Not every provider is cutting corners. There are examples, including within the West Midlands, of shared accommodation that is well managed, properly maintained, and entirely suitable for the people living there. That is not in dispute, and it should not be.
But that is not what this map is about.
This is about scale and direction. When housing changes at this level, it affects more than just the properties themselves. It affects the streets they sit in, the stability of neighbourhoods, and the long-term shape of communities. Over time, those changes begin to influence the kind of businesses that operate locally, the level of investment that follows, and the overall character of an area.
These are not dramatic shifts that happen overnight. They are gradual. Often barely noticeable at first. But over time, they accumulate. A street feels different. A neighbourhood settles into a new pattern. What was once mixed begins to move in a particular direction.
That is not a judgement. It is a consequence of how housing systems operate when they reach this kind of scale.
And it is why this map matters.
Because it allows you to see that process as it is happening, rather than after it has already taken hold.
For many people reading this, the realisation will be a simple one. This is not something happening somewhere else. It may already be happening in your area. It may already be part of the street you live in, or the one next to it. And if it is not there yet, it may be coming.
You do not need to be a housing expert to understand that. You only need to look at the pattern and recognise what it shows.
Birmingham is heading into an election. There will be plenty of talk about growth, regeneration and opportunity. Those are important issues and they deserve attention. But alongside them sits something more immediate, something already in place and already shaping parts of the city.
This system.
It is structured. It is concentrated. And it is known.
That is what this document makes clear.
This is the first step in setting that out properly. The next question, which we will examine in detail, is a straightforward one. If the council can see this, if it holds the data and understands the scale, why does it continue to expand, and who is prepared to take control of it?